Difference between revisions of "Browser Developer Tools"
From Roll20 Wiki
Andreas J. (Talk | contribs) m |
Andreas J. (Talk | contribs) m |
||
| Line 11: | Line 11: | ||
==Uses in Roll20== | ==Uses in Roll20== | ||
* Get extra info to send with a [[Bug|Roll20 bug report]] | * Get extra info to send with a [[Bug|Roll20 bug report]] | ||
| + | * For [[Macro purposes, identify attribute names in character sheets | ||
* Tweaking Roll20 looks with [[Stylus]] | * Tweaking Roll20 looks with [[Stylus]] | ||
**as long as something isn't part of the {{c|<canvas>}}, one can write & edit {{wiki|CSS|CSS}} snippets that changes the look for yourself if you save it as a userstyle with Stylus. | **as long as something isn't part of the {{c|<canvas>}}, one can write & edit {{wiki|CSS|CSS}} snippets that changes the look for yourself if you save it as a userstyle with Stylus. | ||
Revision as of 07:14, 25 August 2022
Page Updated: 2022-08-25 |
Using the built in Web Dev tools in your browser helps a lot with figuring things out. Both Firefox & Chrome (others) have their own versions.
Open it: pressing F12 or Right Click anywhere & select "Inspect".
- Firefox Web Developer Tools
- Chrome DevTools
- Open with Cmd+Option+C (Mac), Ctrl+Shift+C
Uses in Roll20
- Get extra info to send with a Roll20 bug report
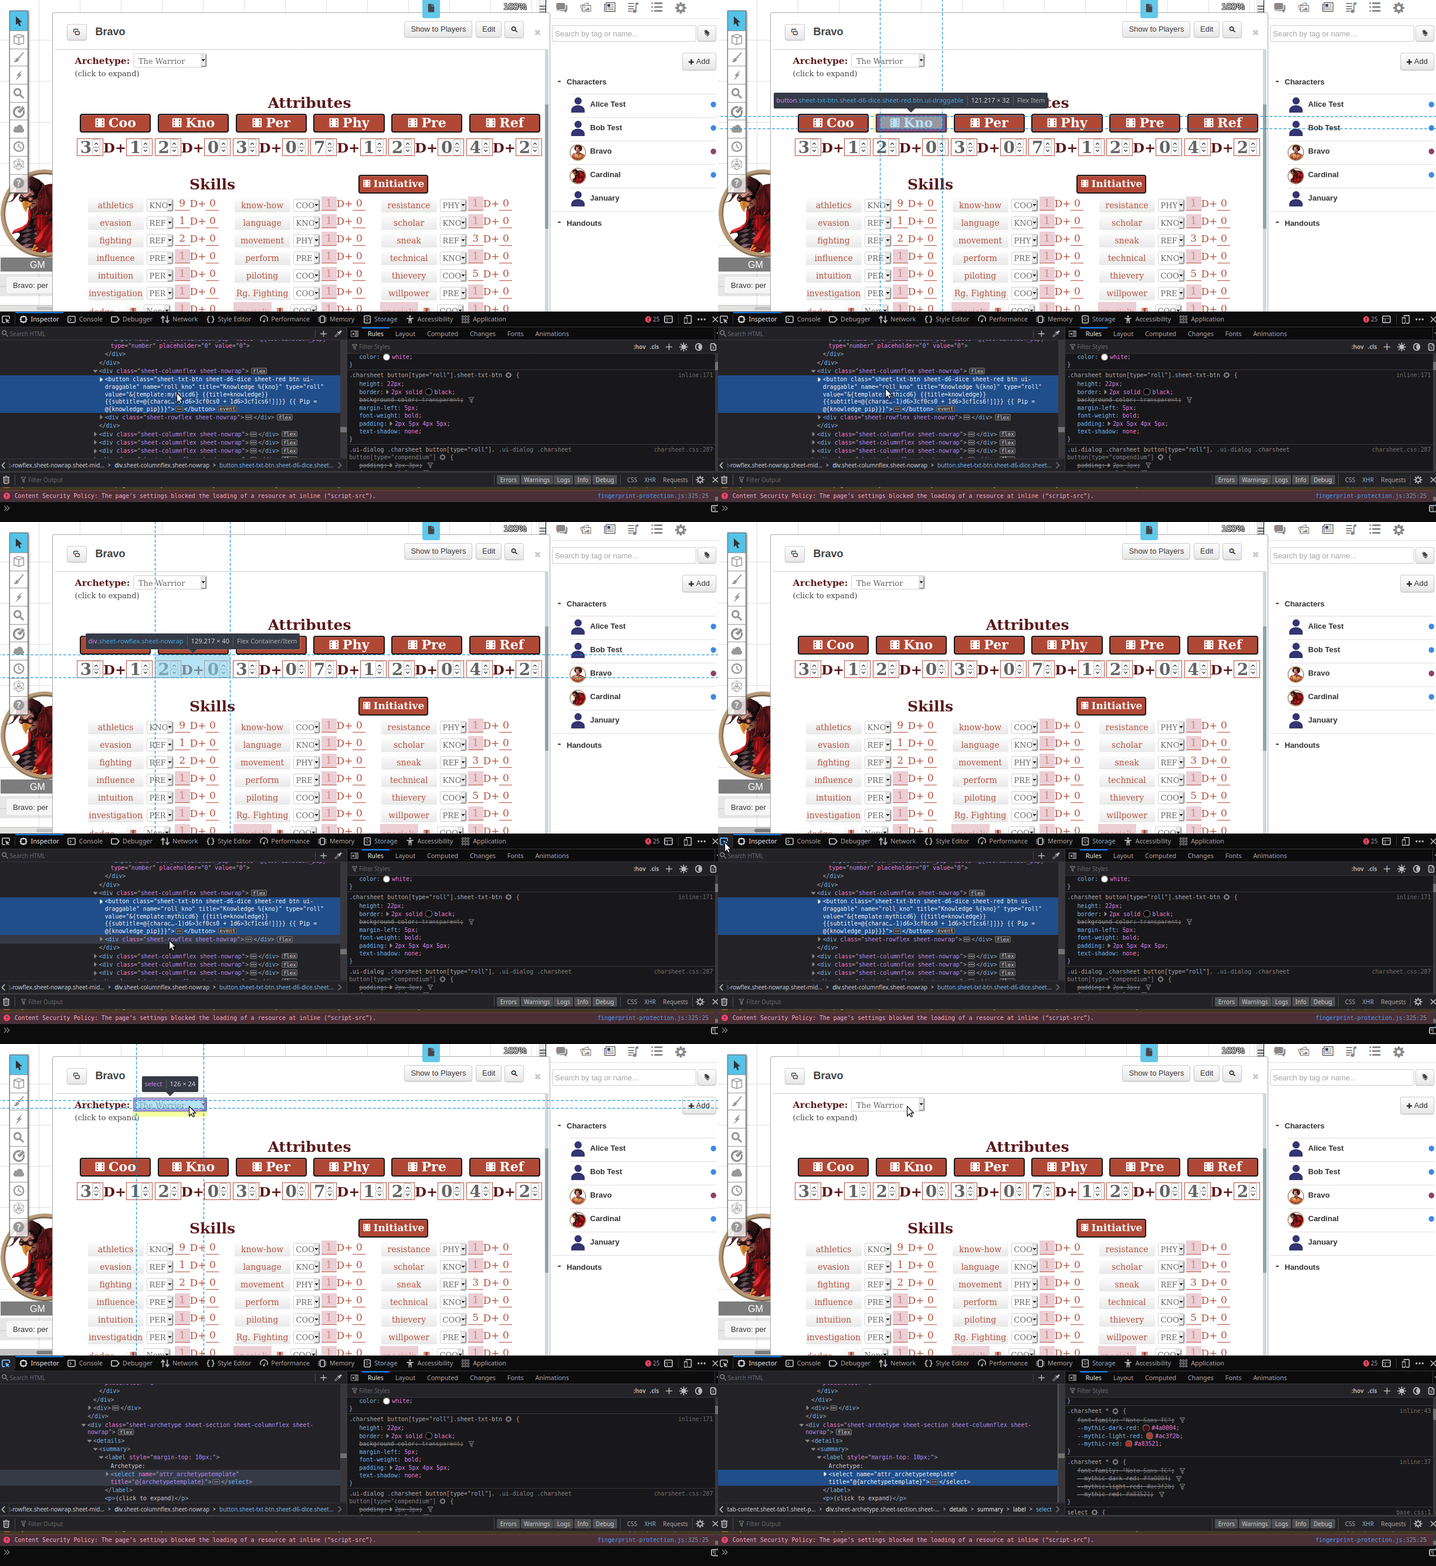
- For [[Macro purposes, identify attribute names in character sheets
- Tweaking Roll20 looks with Stylus
- as long as something isn't part of the
<canvas>, one can write & edit CSS snippets that changes the look for yourself if you save it as a userstyle with Stylus.
- as long as something isn't part of the
Macros
- looking up the names of sheet attributes or Repeating Sections
- Figure out RowID of something in a Repeating Section. Some sheets makes the RowID easy to find, but majority of sheet's don't.
- Especially useful on newer by Roll20-sheets where we don't have public sourcecode for the sheet.
- Can be quicker than searching through the public sourcecode
Character Sheet Development
- make live edits on you sheet and see how things change(like adjusting the width of a number input to look good)
- inspecting other's sheets to se how they achieved some specific effect.
- HTML/CSS debugging: figure out why something works or doesn't work in your code, to narrow down the problem, like why a css class is not working.
- sheetworkers/javascript debugging: reading the web console to figure out what's going on with your sheetworkers. Open the console and keep an eye on it when you use the sheet like normally & see what it reports.
- Example: If you add something like
console.log("ifWounded is trigger")orconsole.log("Set strength mod to" + strmod)() in your sheetworkers, you can see what steps that take place, what is left out, and know what values your variables have at different stages.) - JS Debugging in Chrome, and in Firefox
- Example: If you add something like


