Difference between revisions of "Character Sheet Development/Debugging"
From Roll20 Wiki
Andreas J. (Talk | contribs) (Created page with "<noinclude> {{revdate}}{{BCS}} {{main|Character Sheet Development}} __NOTOC__ ==Code Validation== {{main|Sheet Author Tips}} It's a good idea to use a validator to check your ...") |
Revision as of 15:10, 4 March 2022
Page Updated: 2022-03-04 |
| This is related to Editing(coding) Character Sheets, which require Pro info to be able to use.Main Page: Building Character Sheets |
Main Page: Character Sheet Development
Code Validation
Main Page: Sheet Author Tips
It's a good idea to use a validator to check your code for mistakes in your code. Many IDE & text editors can install such extensions automatically, but given that Roll20 does a few things their own way, by default a HTML validator would complain about lot of things that aren't wrong, but just isn't accepted as standard HTML, such as <button type="roll"></button>.
- HTML: W3C's HTML Validator
- initially give many warnings and errors on roll20-specific things, but you can filter away things that aren't wrong, and the list of error is quickly reduced to a manageable amount
- Debugging HTML
- CSS: W3C's CSS Validator
- JavaScript(for sheetworkers & API): Closure Compiler for JS
- JSON(for translation files & sheet.json: jsonlint.com
Browser Dev Tool
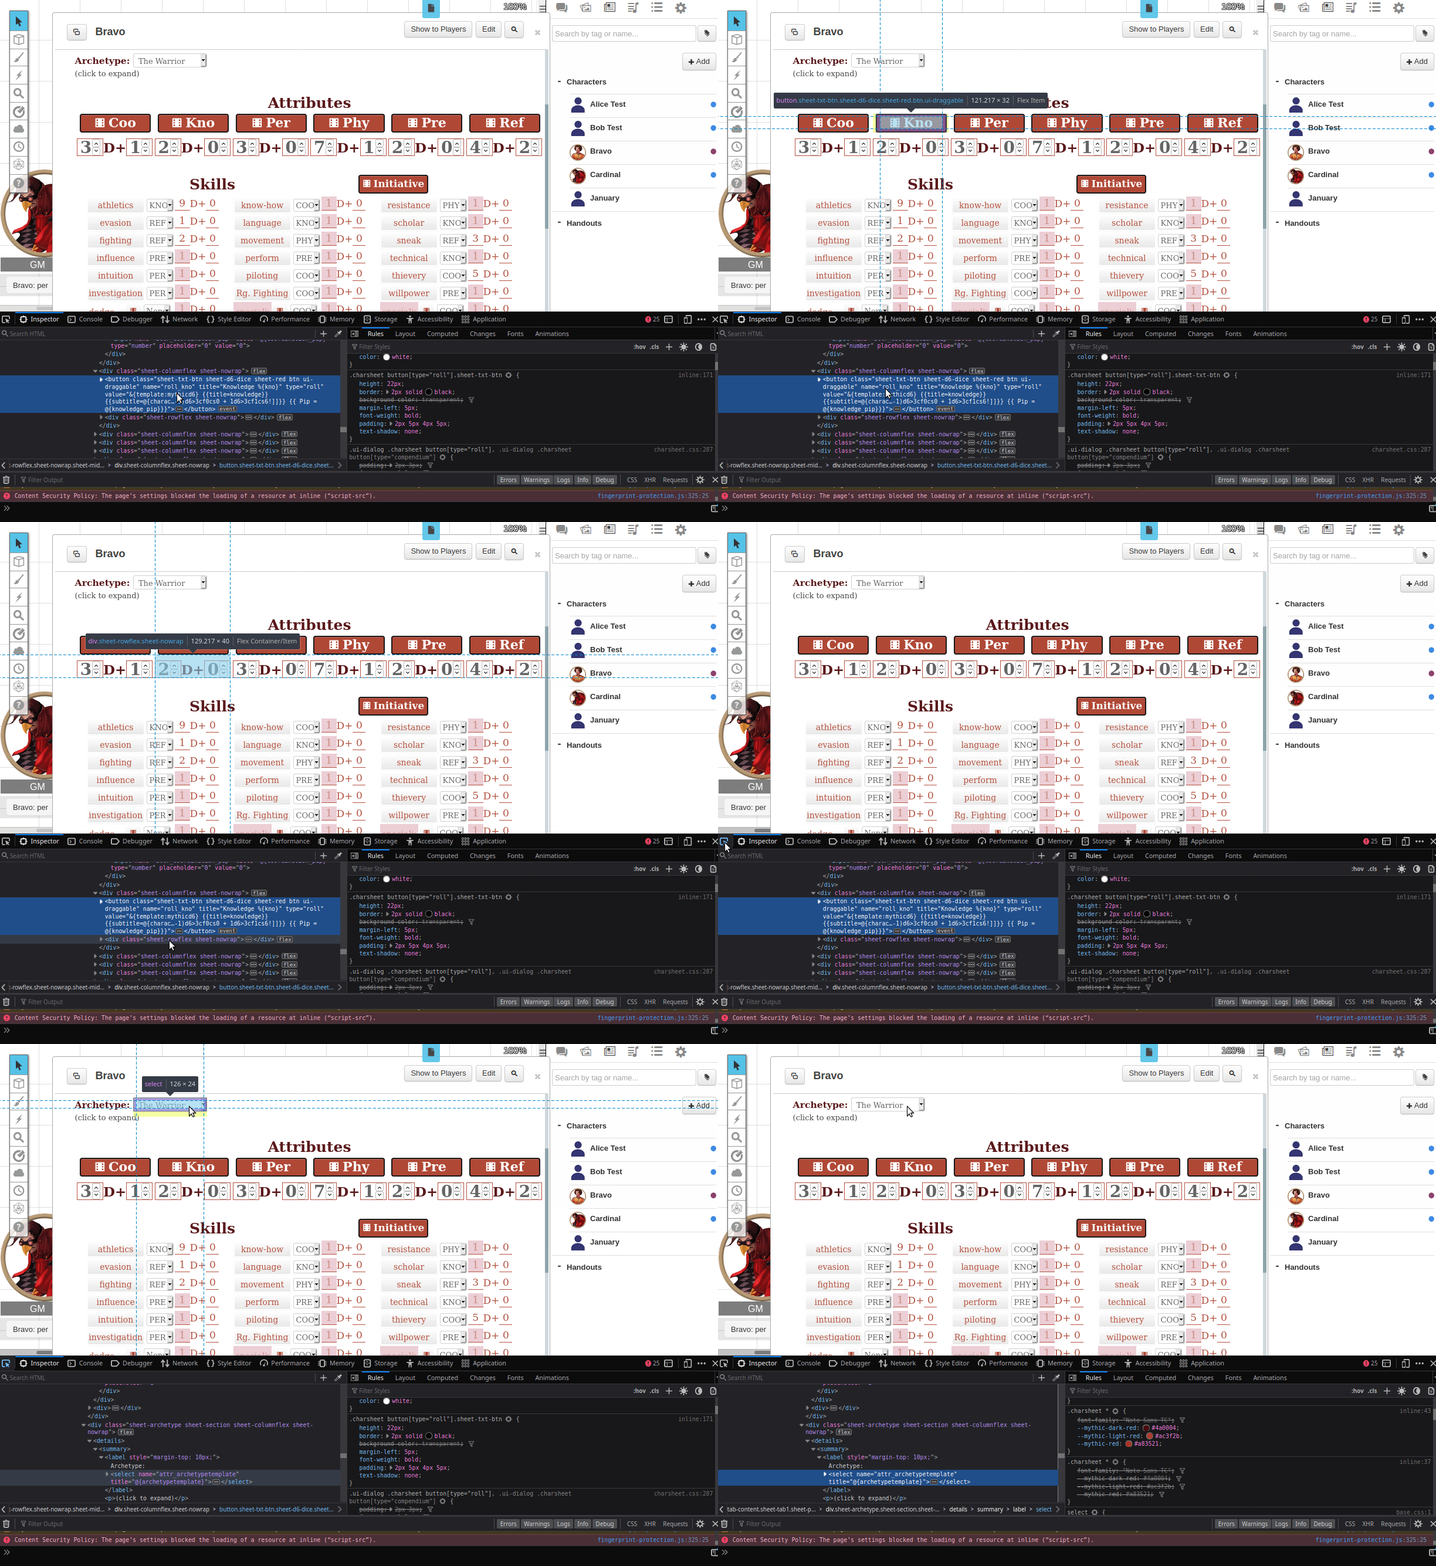
Using the built in Web Dev tools in your browser helps a lot with figuring things out. Both Firefox & Chrome (others) have their own versions.
Open it: pressing F12 or Right Click anywhere & select "Inspect".
- Firefox Web Developer Tools
- Chrome DevTools
- Open with Cmd+Option+C (Mac), Ctrl+Shift+C
Sheet Dev Uses
- make live edits on you sheet and see how things change(like adjusting the width of a number input to look good)
- inspecting other's sheets to se how they achieved some specific effect.
- HTML/CSS debugging: figure out why something works or doesn't work in your code, to narrow down the problem, like why a css class is not working.
- Debugging HTML and Debugging CSS
- sheetworkers/javascript debugging: reading the web console to figure out what's going on with your sheetworkers. Open the console and keep an eye on it when you use the sheet like normally & see what it reports.
- Example: If you add something like
console.log("ifWounded is trigger")orconsole.log("Set strength mod to" + strmod)() in your sheetworkers, you can see what steps that take place, what is left out, and know what values your variables have at different stages.) - JS Debugging in Chrome, and in Firefox
- Example: If you add something like


